Analysis Graphs

Go to tab analyses and click on it > graphs.
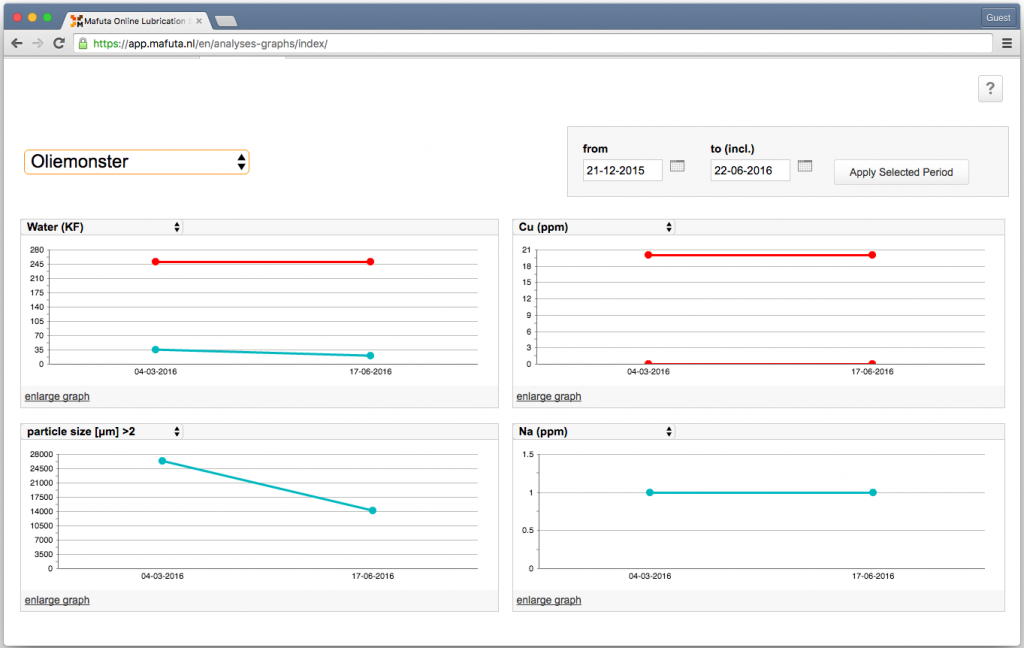
Select a sample from the drop down list and select the period. Then click on the button ’apply selected period’.
Then you can select four different elements from the drop down list from which you want to see the results.
These graphs show all the results of that element as specified in the last 5 reports.
The red lines in the graphs represent the alarm values that are set for that task and that specific element. This way you can always see if the analysis values are within the standard.

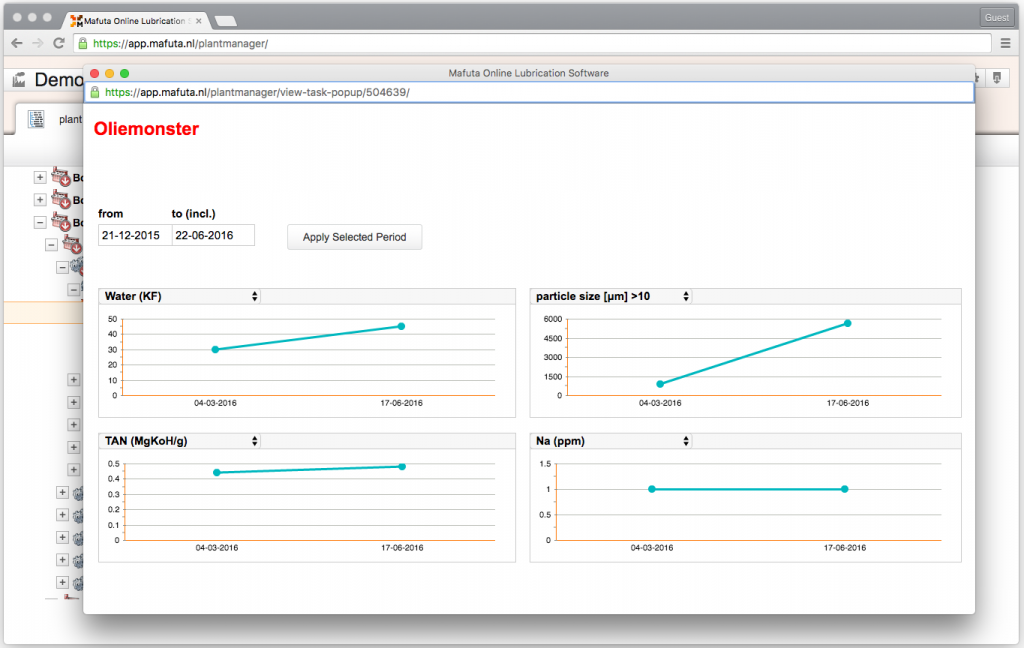
You can also see the graph from the tree view, the graph view will then open in a seperate popup.

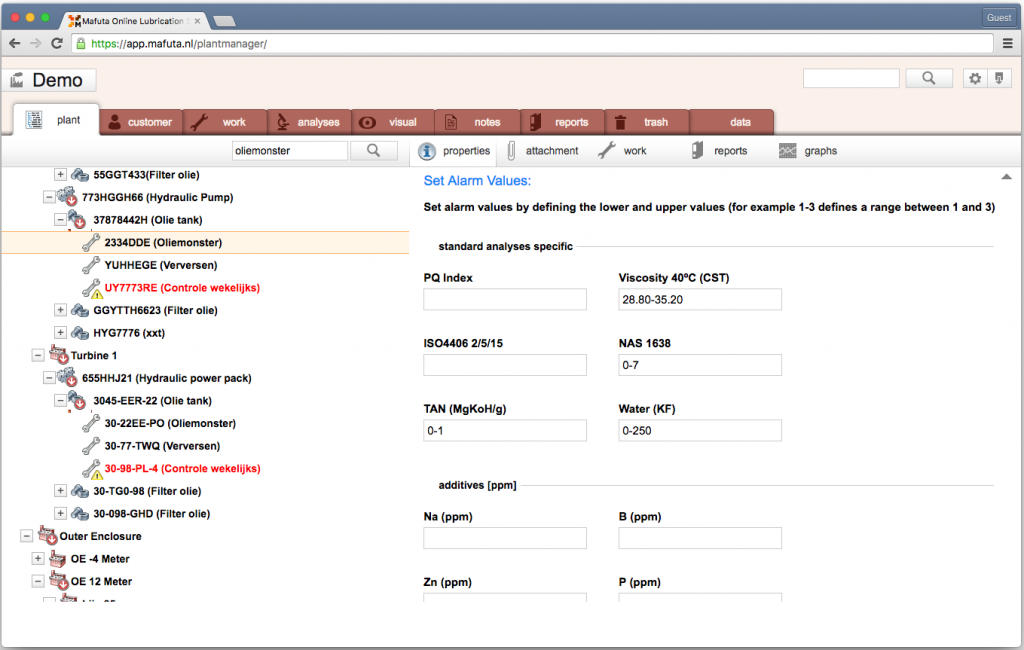
You can set the alarm values from the tree view.
First select a sample from the tree view. On the right the properties tab will open and here you can set the alarm values.


 De Prinsenhof 1-02, 4004 LN Tiel, The Netherlands
 Phone: +31 (0) 48 75 10 618, Fax: +31 (0) 48 75 15 384
 E-mail: uptimeworks@ijssel.com
  Copyright 2010 Mafuta consulting